Distributed Tracing!
Senior software engineer Sally Ann O'Malley describes recent additions to the Operate First cloud that simplify the collection of OpenTelemetry data. Catch her on K8s slack or GitHub @sallyom
Over the past few years, the open source project OpenTelemetry has advanced cloud-native observability. As modern software platforms have become more distributed and complex, observing application data has become more critical and also more difficult. OpenTelemetry is a collection of tools, APIs, standards, and SDKs to instrument, generate, collect, and export telemetry data (metrics, logs, and traces). With OpenTelemetry (OTLP), end-users and developers are empowered to choose a telemetry backend that suits their needs. It is vendor neutral, open source, and is supported by industry leaders in the observability space. This post describes recent additions to the Operate First community cloud that have made it easy for users to collect and analyze OTLP.
To learn more about the Operate First community cloud and how you can access it, visit the onboarding docs. If, like me, you're a developer wishing to deploy your applications and perform testing in a production environment, you might start here. From there you can onboard your Kubernetes based cloud-native workloads with help from the Operate First community.
Recently, two Operators were deployed on the Operate First Smaug cluster that enable collection of OTLP data from any application.
The operators are Red Hat Distributed Tracing Platform and Red Hat Distributed Tracing Data Collection.
The former includes a Jaeger operator for visualizing OTLP data and the latter includes the OpenTelemetry operator that manages namespaced OpenTelemetryCollectors to collect OTLP.
These and many other operators are available from the Certified OpenShift Operators Hub.
This post describes how to connect your applications and workloads to these distributed tracing operators to reach your observability goals.
For an excellent overview of observability in general, check out this blog from Ben Evans and Red Hat Developer.
Table of Contents
- Introduction
- Red Hat Distributed Tracing Data Collection
- Red Hat Distributed Tracing Platform
- Example Application
- Connecting to OpenTelemetry Collector
- Connecting to Jaeger
- Visualizing Your Data
- Summary
Introduction
With OpenTelemetry, it is relatively straight-forward and usually involves a few lines of code to add OTLP instrumentation. In fact, it is a core mission of the OpenTelemetry project to make instrumenting easy and universal, to uncouple instrumentation from data storage and analysis. The instrumentation docs are an excellent starting place. The more complicated issue is how to collect, export, visualize, and analyze application data. That is what has been simplified with the distributed tracing operators now running in Operate First.
Red Hat Distributed Tracing Data Collection
The Red Hat Distributed Tracing Data Collection operator is an opinionated OpenTelemetry Collector Operator.
It is easy to install from the OperatorHub as an OpenShift administrator.
Once running, regular users can create its custom resources in their own projects.
The operator watches all namespaces in the Smaug cluster for namespaced custom resources OpenTelemetryCollector and Instrumentation.
In a cluster with this operator running, these resources can be accessed from the OpenShift console's left navigation menu Installed Operators > <operator-name>.
The presence of an OpenTelemetryCollector in a namespace (project) triggers the creation of several resources in that namespace including a deployment of the OpenTelemetry Collector. In simple terms, all that is required to launch an OTLP collector in your namespace is the creation of an OpenTelemetryCollector. This custom resource configures OTLP receivers and exporters. An OTLP collector is an intermediary that allows OTLP data to be funnelled to a variety of backends. Traces, logs, and metrics can be exported from an application with a single OTLP collector.
The presence of an Instrumentation custom resource triggers the automatic instrumentation of an application.
This is available for a limited list of languages.
At this time Python, Java, and Ruby offer auto-instrumentation. For more information, visit the automatic instrumentation docs.
Visit the Red Hat Distributed Tracing Data Collection documentation and the OpenTelemetry Operator project on GitHub for additional details and examples.
Red Hat Distributed Tracing Platform
The Red Hat Distributed Tracing Platform is an opinionated Jaeger Operator.
This operator watches all namespaces in the Smaug cluster for any namespaced Jaeger custom resources.
The presence of a Jaeger in a project triggers the creation of several resources including a deployment of Jaeger along with a route to the Jaeger frontend.
In a cluster with this operator running, these resources can be accessed from the OpenShift console's left navigation menu Installed Operators > <operator-name>.
The example below creates an AllInOne instance of Jaeger that uses in-memory storage.
For production modes, visit the Red Hat Distributed Tracing Platform documentation.
Jaeger is a tool to analyze traces.
There are many vendors and open source projects that offer backends for traces, logs, and metrics - all of which can be funnelled through a single OTLP collector.
The OpenTelemetry Registry lists OTLP compatible tools.
Example Application
For this blog, an example golang application is deployed in the Smaug cluster otel-dev project.
The application includes a simple web server, a service that exposes port 8080 of the web server pod, and a route that exposes the service.
View the single yaml file here.
Note: All objects will be created in
otel-devnamespace (project), including the namespace itself.
Since Smaug is an OpenShift cluster, here we use the command-line tool oc.
However, kubectl can be substituted and used with any Kubernetes based cluster.
Create the sample application
oc apply -f https://raw.githubusercontent.com/sallyom/golang-ex/master/opentelemetry-sample-app/sample-app-w-route.yamlTwo files are served by this application.
A Hello OpenTelemetry page and a counter.
Visiting the pages creates trace spans that can be collected with the OpenTelemetry Collector and visualized with Jaeger.
Connecting to OpenTelemetry Collector
Because the Smaug cluster is running the OpenTelemetry Operator, it is very easy to launch a collector in any namespace.
This is the OpenTelemetryCollector custom resource that was created in the otel-dev project, alongside the example application.
This definition is also found here
otelcol.yaml
apiVersion: v1
kind: ConfigMap
metadata:
  annotations:
    service.beta.openshift.io/inject-cabundle: "true"
  name: otelcol-cabundle
  namespace: otel-dev
---
apiVersion: opentelemetry.io/v1alpha1
kind: OpenTelemetryCollector
metadata:
  name: otelcol
  namespace: otel-dev
spec:
  config: |
    receivers:
      otlp:
        protocols:
          grpc:
          http:
    processors:
      batch:

    exporters:
      logging:
        loglevel: debug

      jaeger:
        endpoint: jaegerex-collector-headless.otel-dev.svc:14250
        tls:
          ca_file: "/etc/pki/ca-trust/source/service-ca/service-ca.crt"

    service:
      pipelines:
        traces:
          receivers: [otlp]
          processors: [batch]
          exporters: [logging,jaeger]
  mode: deployment
  resources: {}
  targetAllocator: {}
  volumeMounts:
  - mountPath: /etc/pki/ca-trust/source/service-ca
    name: cabundle-volume
  volumes:
  - configMap:
      name: otelcol-cabundle
    name: cabundle-volume
Notice the receivers are the default OTLP grpc and http values (left empty, the collector will use the defaults).
These are appropriate 99% of the time.
There are two exporters configured, Logging and Jaeger.
With the jaeger exporter, the endpoint is specified along with the ca_file that is mounted from the otelcol-cabundle configmap.
This configmap utilizes OpenShift's auto-certificate mechanism in which a configmap with the annotation service.beta.openshift.io/inject-cabundle: "true" will result in that configmap populated with a Certificate Authority valid for the cluster, to enable secure communication with the Jaeger pod.
The mode is also specified as a deployment.
Once the receivers and exporters are configured, all that's left to do is specify a service pipeline.
Here we've configured a traces pipeline.
Refer to the OTLP Collector documentation for more detailed explanations of its options.
Create the OpenTelemetryCollector
oc apply -f https://raw.githubusercontent.com/sallyom/golang-ex/master/opentelemetry-sample-app/otelcol.yamlThat's it! Now the OTLP collector will be collecting trace data from any instrumented application that is running in the otel-dev namespace and that is configured to connect to the collector service address.
Note: The OpenTelemetryCollector is configured to connect to the Jaeger service at the default port
14250. Below, when creating aJaegerinstance, the resource name must match the name in the Jaeger service address listed in the collector. Here it isjaegerexwhere the service address will bejaegerex-collector-headless.otel-dev.svc:14250.
Connecting to Jaeger
Because the Smaug cluster is running the Jaeger Operator, it is easy to launch Jaeger in any namespace.
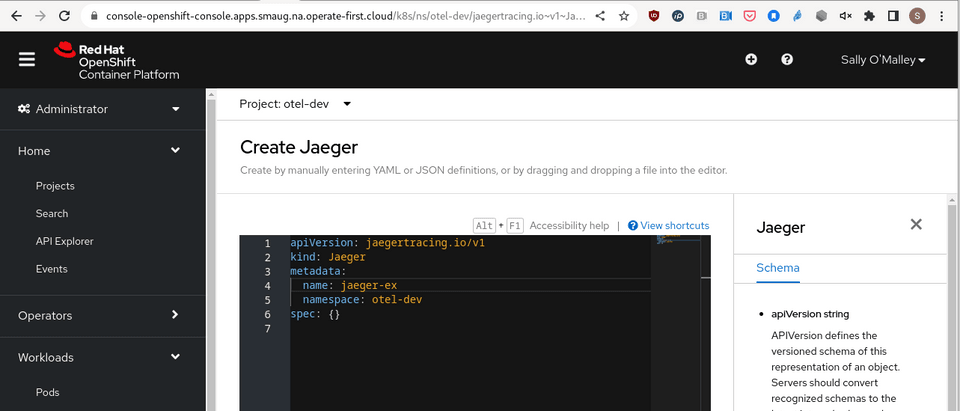
The Jaeger All-In-One is created in the otel-dev namespace by searching API Explorer for Jaeger then Create Jaeger under Instances.
Also, because the OpenTelemetry collector is already configured to export and connect to the Jaeger service, this is all that is required.
This Jaeger resource triggers the creation of everything required to visualize the trace data from the OTel collector running in the same project.

Similar to the OpenTelemetryCollector, a Jaeger can also be created from the command line. Here is the definition for the simplest All-In-One Jaeger resource. The definition is also found here.
jaeger.yaml
apiVersion: jaegertracing.io/v1
kind: Jaeger
metadata:
  name: jaegerex
  namespace: otel-dev
Create a Jaeger instance
oc apply -f https://raw.githubusercontent.com/sallyom/golang-ex/master/opentelemetry-sample-app/jaeger.yamlVisualizing Your Data
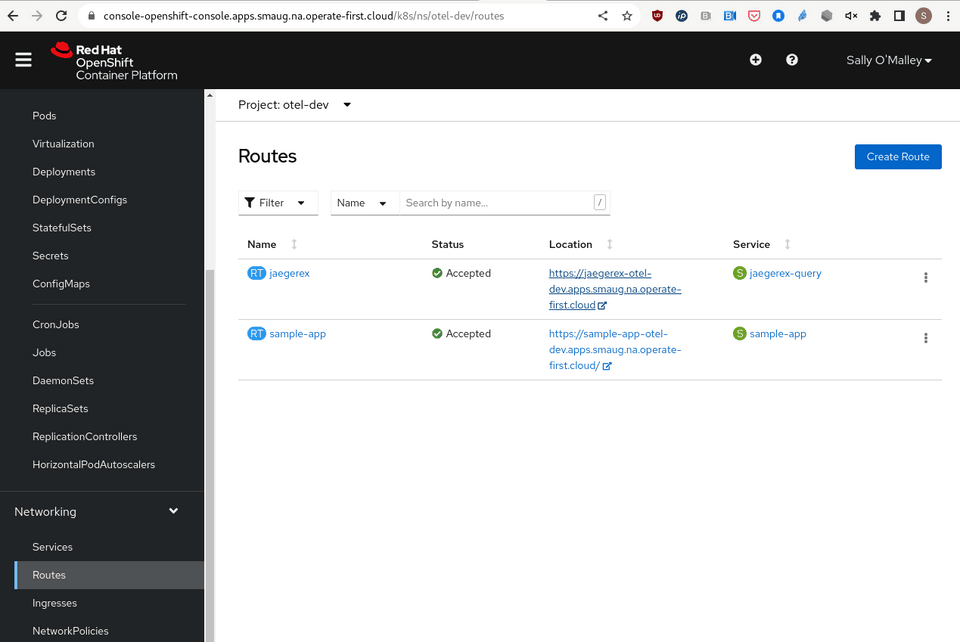
Creation of a public route for the Jaeger frontend is triggered by the existence of a Jaeger.
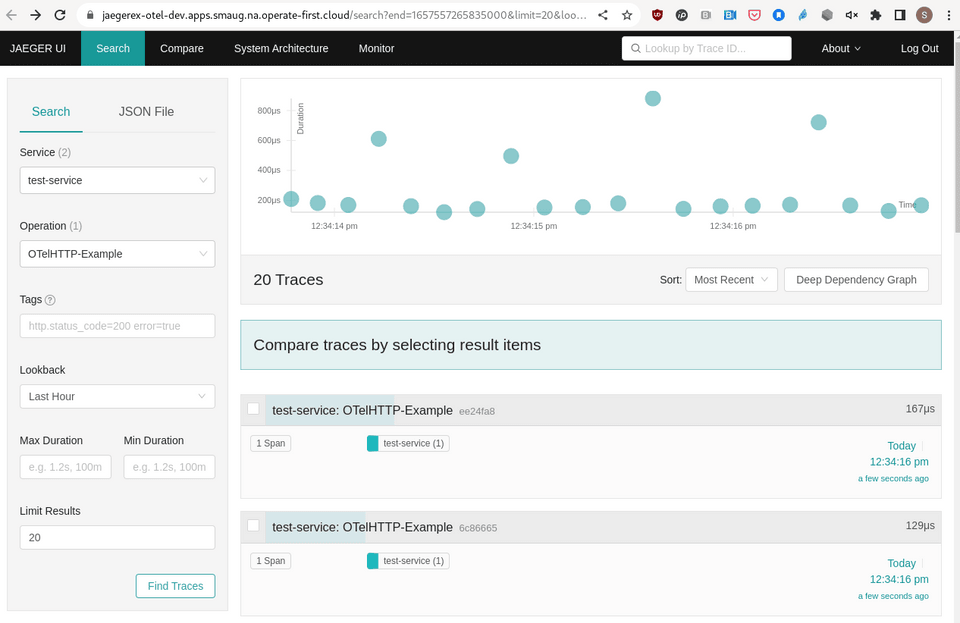
All that is left to do now is visit the frontend at the jaegerex Route.
View the route from the application running in Operate First at https://jaegerex-otel-dev.apps.smaug.na.operate-first.cloud/.
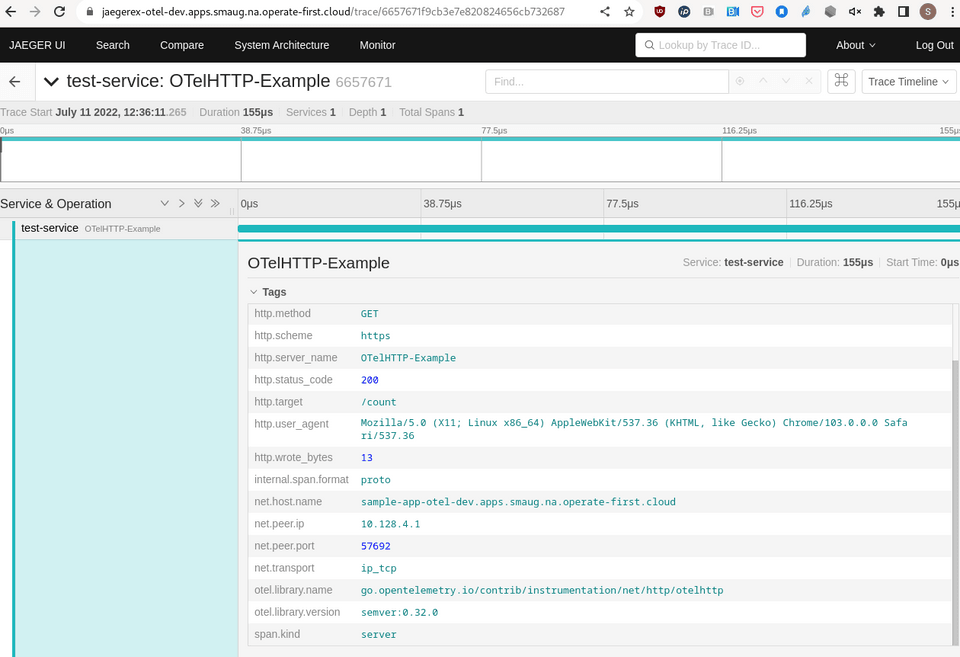
You can generate trace data by visiting the /hello and /count pages.


A powerful debugging tool results from correlating log data with trace data (and metrics, too).
You can correlate spans with logs by filtering span_id and trace_id from the sample-app pod logs.
Doing so, you can gather additional information about any span from a Jaeger trace.
To view logs from the application that include span_id & trace_id information:
oc get logs -n otel-dev [sample-app-podname]

Summary
Now that Red Hat Distributed Tracing Platform and Red Hat Distributed Tracing Data Collection are deployed in the Smaug cluster, viewing OTLP data from instrumented applications is a breeze!
- Install Red Hat Distributed Tracing Platform & Red Hat Distributed Tracing Data Collection from the Operator Hub
- these are already running in the Smaug cluster
- Deploy an OTLP instrumented application
- Create an
OpenTelemetryCollectorin the project/namespace - Create a
Jaegerinstance in the project/namespace - Edit the collector resource to configure a Jaeger exporter at
jaeger-name.collector-headless.project-name.svc:14250(grpc)
The example application is quite boring - try out your own application in Operate-First!